


Bulletin: 180
Date: November 14, 2025
Plastic Raw Materials in Europe – Contraction and Pressure (October 2025)
The European market for plastic raw materials (virgin and reprocessed) has been experiencing a significant contraction in demand for about two months, resulting in a drop in prices and low levels of orders. This situation transcends the usual cycle and is driven by a confluence of structural, regulatory and macroeconomic factors that erode industrial competitiveness and final consumer confidence. Prudent inventory management and a strategic focus on highly circularity (reprocessed) materials are required to mitigate the impact.
- Analysis of the Causes of Contraction
- Deterioration of Demand and Industrial Competitiveness
European plastics production has fallen (e.g. by 8.3% in 2023, and the global share has fallen from 22% in 2006 to 12% today). This generates less domestic demand for raw materials and causes facility closures.
High energy costs and environmental taxes (e.g. taxes on non-recycled plastic/packaging) are significantly higher than those of other competitors (mainly Asia), affecting the profitability and production volume of transformers.
Cases such as Plastiverd’s (if it is a well-known example in the sector) are symptoms of the competitiveness crisis that reduces the ability to buy commodities.
- Macro and Geopolitical Impact
Wars (Ukraine/Russia, Middle East) create volatility in energy and transport prices, indirectly affecting the cost of virgin polymers (petroleum derivatives).
The possibility of changes in U.S. tariff policy creates uncertainty in trade flows. The U.S. is a major source of polymer imports for Europe, and any changes distort markets.
The increase in the tax burden and inflation reduce consumer purchasing power, negatively impacting the demand for durable goods (automotive, white goods) and non-essential consumer films or packaging.
- Regulatory Impact on Final Demand
Ambiguity about future regulations (e.g. transition to electric vehicles, Euro 7 regulations, etc.) paralyzes the final consumer’s purchasing decision, affecting vehicle production rates and, therefore, the demand for engineering plastics, PP, ABS, etc.
The new legislation proposes minimum requirements for recycled content in vehicles (e.g. 20% in vehicle plastics). While it benefits reprocessed foods, it creates confusion in virgin demand and requires complex certifications for compounders.
The reprocessed market is at an inflection point. Although there is growing structural demand driven by legislation (e.g. recycled content requirement), the general weakness of demand and high pressure on virgin prices are also dragging down recycled prices, making it difficult to invest in new capacities.
The EU directives on single-use plastics and the growing consumer preference for alternatives (e.g. paper, cardboard or bio-based plastics) put long-term structural pressure on food/non-food film and packaging.
Conclusion
The current situation in the plastics market in Europe is one of structural deterioration. The fall in demand is amplified by regulatory uncertainty and the loss of competitiveness. For your business, the strategy should focus on reducing virgin stocks, where the risk of falling prices is greatest.
(Sources: Plastics Europe, Eurostat, ECB, End-of-Life Vehicles Regulation, ICIS, Platts, SUPD)
PET is a crucial material, especially for beverage and food packaging.
🇪🇺 Trends and Changes in PET Capacity (2020 – 2025)
Plastiverd Closing (Spain):
It is a relevant player with a capacity of 210,000 tonnes/year that has just announced the cessation of its activity, or at least the shutdown of its virgin PET lines.
Transition of Capacity from Virgin to Recycled (rPET):
The European market trend, driven by legislation (especially the Single-Use Plastics Directive and recycled content targets), has been to invest heavily in rPET (recycled PET).
Large manufacturers such as Indorama have announced or executed plans to increase their recycling capacity, such as the 30,000 tonnes per year waste project at its plant in San Roque, Spain.
Impact of the Competitiveness Crisis:
The European plastics sector in general (including PET) has suffered a significant loss of competitiveness between 2023 and 2025 due to high energy costs, as indicated by Plastics Europe reports.
Although the total closure of the other large virgin PET plants (such as those of Indorama, NEO GROUP or JBF-RAK) has not been reported, many have had to operate with very low utilization rates due to weak demand and import pressure.
Below is a summary of the installed capacity and food-grade rPET projects in Europe, highlighting the situation of the main players you mentioned:
♻️ Food Grade rPET Capacity and Projects in Europe (2024-2025)
The main driver of rPET is EU legislation, which requires PET bottles to incorporate a minimum of 25% recycled content by 2025. This has skyrocketed investment, with the food-grade rPET market being the largest segment in 2024.
| Indicator | Key Fact (General) | Sources and Context |
| Total Installed Recycling Capacity (2022) | Approximately 3 million tons of PET for recycling. | ICIS Report (2024). This includes all applications (fibers, foils, strapping, and food grade). |
| Food Grade Capability (2022) | Approximately 1.4 million tons destined for food contact applications. | It is the fastest growing segment and the one that competes directly with V-PET. This figure is expected to be significantly higher in 2024-2025. |
| Recycled Content Rate (2022) | The average for PET bottles reached 24% in the EU. | This shows that the industry is close to meeting the legal target of 25% by 2025, validating the high demand for rPET. |
Status of Key Manufacturers (V-PET and rPET)
Manufacturers who dominated the production of V-PET (virgin) are pivoting and investing heavily in rPET to secure their place in the circular supply chain:
Key Factors of European PET: Transition to rPET (Consolidated Analysis Nov. 2025)
| Maker | V-PET EU Capacity (Tms./year) | rPET (Recycling) Strategy and Current Situation | Impact and Role in the European Market |
| INDORAMA (IVL) | ~535,000 (Poland, Lithuania) | Global Leadership: Vertical integration with large investments. Announcement of new food-grade rPET plants (e.g. 30,000 Tms./year in Spain). | Leader in circularity. Strong position to provide blends (V-PET + rPET) in compliance with the SUDD Directive. |
| NOVAPET | 260,000 (Barbastro, Spain) | REnovaPET Strategy: Vertical Integration in Spain. Post-consumer mechanical recycling capacity of more than 25,000 tons/year. | Leader in the Iberian market. Strong positioning in the supply of food-grade rPET, crucial to maintaining market share. |
| ALPEK (via Equipolymers) | 426,000 (Italy and Germany) | Global rPET Strategy: Active pursuit of rPET plant acquisitions. Adaptation of European plants to handle blends. | Cost-sensitive actor. They compete directly with imports. They need to secure rPET so that their packaging customers can comply with the law. |
| NEO GROUP | 432,000 (Lithuania) | Forced to Integrate: Need for strategic alliances or capacity building of rPET to ensure future demand. | Its future depends on the ability to operate profitably and secure the supply of rPET to its customers in Central and Eastern Europe. |
| JBF-RAK | 480,000 (Belgium) | Forced to Integrate: Similar to NEO Group, they must invest in circularity or establish long-term agreements for rPET. | Significant pressure from high costs and import competition. The V-PET segment is the most vulnerable. |
| PLASTIVERD | 210,000 (Spain) | Closing/Sale: Idle V-PET capacity (Post-2020). | Symptomatic of the crisis. Its closure frees up capacity in the Spanish market, but demand migrates directly to rPET and/or cheaper imports. |
Conclusion on rPET
The rPET market is the future of the PET packaging sector in Europe. While V-PET capacity is being shut down or underutilized due to cost pressure and legislation, food-grade rPET capacity is the only segment that is growing (and its growth is expected to continue at a CAGR of around 7% globally).
BRENT
Brent Oil Price Analysis and Forecast (Q4 2025 – Q1 2026)
Current Brent Situation (November 2025)
The price of a barrel of Brent has shown a trend of relative stability, hovering around $63 – $65 USD per barrel at the beginning of November 2025. This stability is due to a delicate balance between supply concerns and weak demand.
- Support Factors: The main source of support comes from OPEC+, which has maintained production cuts to avoid a price collapse.
- Pressure Factors: Weak industrial activity in Asia and record oil production in non-OPEC countries (mainly the United States, which continues to break production records) exert strong downward pressure, limiting any significant rebound.
Forecast for Late 2025 (Q4) and Early 2026 (Q1)
The forecasts of the main institutions and investment banks point to a scenario of moderate downward pressure and high uncertainty, although the ranges of the predictions are wide.
| Institution/Analysis | Forecast for Early 2026 (range/target) | Key Scenario |
| General Consensus | $60 – $70 USD / barrel | The market will remain in a balanced range if OPEC+ continues with its policy of cuts. |
| World Bank (WB) | It forecasts a drop to $60 USD by 2026 (from $68 USD average in 2025). | It anticipates an oil surplus in early 2026. |
| Morgan Stanley | It raised its forecast to $60 USD by early 2026 (from $57.5 USD). | It shows less concern about short-term oversupply but remains cautious. |
| UBS | It maintains a forecast range of $60 – $70 USD per barrel. | It focuses on the risk of oversupply from record US production and weak Asian demand. |
| Bearish Scenario (IEA) | Risk of falling to the $50 USD zone. | The International Energy Agency (IEA) has warned of a record crude surplus in 2026 (supply exceeding demand by more than 4 million barrels per day). |
Price Conclusion: Brent price has a higher probability of settling in the $60 – $65 USD range in Q4 2025 and Q1 2026, but with a significant risk of falling towards the $50 USD zone if the IEA’s projected oversupply materializes and global demand does not pick up.
Key Factors That Will Determine the Price
Volatility will continue, driven by the following factors:
Supply and Demand
Non-OPEC Production (Mainly the US): Record production in the United States ($13.8 million barrels per day, an all-time high) and other non-OPEC+ countries acts as an upside “stopper”, preventing prices from soaring.
- OPEC+ decisions: The key is whether the cartel will stick to production cuts (such as the recent plan to pause production increases in the first quarter of 2026) to counter U.S. supply. Any sign of default or production increase by OPEC+ could collapse the price.
- Demand from China and India: Economic recovery and demand growth in these two large Asian economies are crucial. The weakness in its industrial activity is one of the main factors pushing downwards.
Geopolitics and Risk
- Conflicts and Sanctions: Although the market seems to be more focused on oversupply, geopolitical factors (such as U.S. sanctions against Russian producers or regional conflicts) generate volatility and can cause short-term price spikes if there are supply disruptions.
- Interest Rate and Dollar: The decisions of the Federal Reserve (Fed) and the European Central Bank (ECB) on interest rates affect the value of the dollar. A strong dollar makes oil (priced in dollars) more expensive for buyers using other currencies, which tends to reduce global demand and put downward pressure on prices.
For PET:
A Brent price scenario in the $60 – $65 USD range is generally negative for virgin PET (V-PET) producers, as it reduces the cost of their raw material (naphtha and derivatives), but in an overcapacity environment, this cost reduction is immediately passed on to the final polymer price, keeping PET price pressure down.
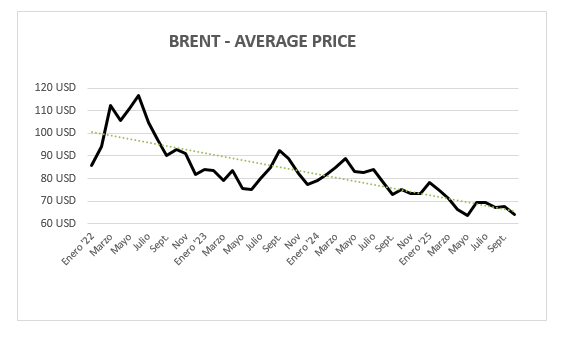
Brent Oil Evolution and Projection for 2025 (USD)
| MINIMUM PRICE | MAXIMUM PRICE | AVERAGE PRICE | |
| January ’25 | 74,72 | 82,63 | 78,15 |
| February | 72,39 | 77,34 | 74,84 |
| March | 68,33 | 74,81 | 71,32 |
| April | 58,40 | 74,47 | 66,32 |
| May | 58,50 | 66,81 | 63,70 |
| June | 63,00 | 79,40 | 69.39 |
| July | 66,34 | 73,63 | 69,42 |
| August | 64,79 | 72,00 | 67,13 |
| September | 65,07 | 70,76 | 67,52 |
| October | 59.97 | 66,64 | 63,86 |
| November | |||
| December |
GDPR: Data Protection Information of MARSELLÀ GLOBAL S.L. (smarsella@marsellaglobal.com):
PURPOSE: To inform you of our products and services by electronic means. LEGITIMATION: Legitimate interest in keeping you informed in your capacity as a client and/or user. ASSIGNMENTS: Not contemplated. CONSERVATION: During the contractual relationship and/or until you request us to cancel the contract and during the periods required by law to meet any liabilities once the relationship has ended. RIGHTS: You can exercise your right of access, rectification, deletion, portability of your data and limitation or opposition in the email of the responsible party. In the event of disagreements, you can file a complaint with the 72Data Protection Agency (www.aepd.es).
This newsletter is prepared based on the information and experience of our sales team. Marsella Global, SL pays special attention to its preparation, however, we cannot guarantee the accuracy and usefulness of the content published.
The recipient accepts the content of this newsletter on the understanding that Marseille Global, SL is not responsible for any damage caused by the use of the information contained in this document.


Comments are closed.